Compare · up to five apps · both stores
Compare apps: revenue, downloads and prices side by side
Short answer: to compare apps, put them in one view and read ratios, not single numbers. GetAppNiche Compare takes up to five App Store or Google Play apps and shows each one's share of the group's revenue, revenue per download, downloads, plan prices, rating and update pace, with the main differences written out in plain words.
Example Five weight loss and calorie tracking apps · GetAppNiche data, US App Store, Nov 13, 2026
Share of the group's monthly revenue
- MyFitnessPal 84%
- Cal AI 9%
- Lose It! 3%
- WeightWatchers 3%
- Noom 1%
Worked example · GetAppNiche data, US App Store, Nov 13, 2026
Which weight loss and calorie tracking app earns the most? Five apps compared
MyFitnessPal earns more than the other four together: it has 54% of the group's downloads and 84% of its revenue. The bar above and the table below are how the Compare screen reads the group. Shares and store facts are open here; the dollar figures are in the app.


GetAppNiche data, US App Store, Nov 13, 2026. Shares are of the five apps' combined monthly App Store revenue and downloads. Revenue per download is each app's figure against the group's average (1.0×). Plan prices are the lowest listed purchase whose name states that length; — = no purchase names it. All five are Health & Fitness apps rated 4.70–4.84, so the rating does not explain the gap; revenue per download does: MyFitnessPal at 1.6× the group's average, WeightWatchers at 0.22×.
Inside the app comparison tool: who is growing, and what changed first
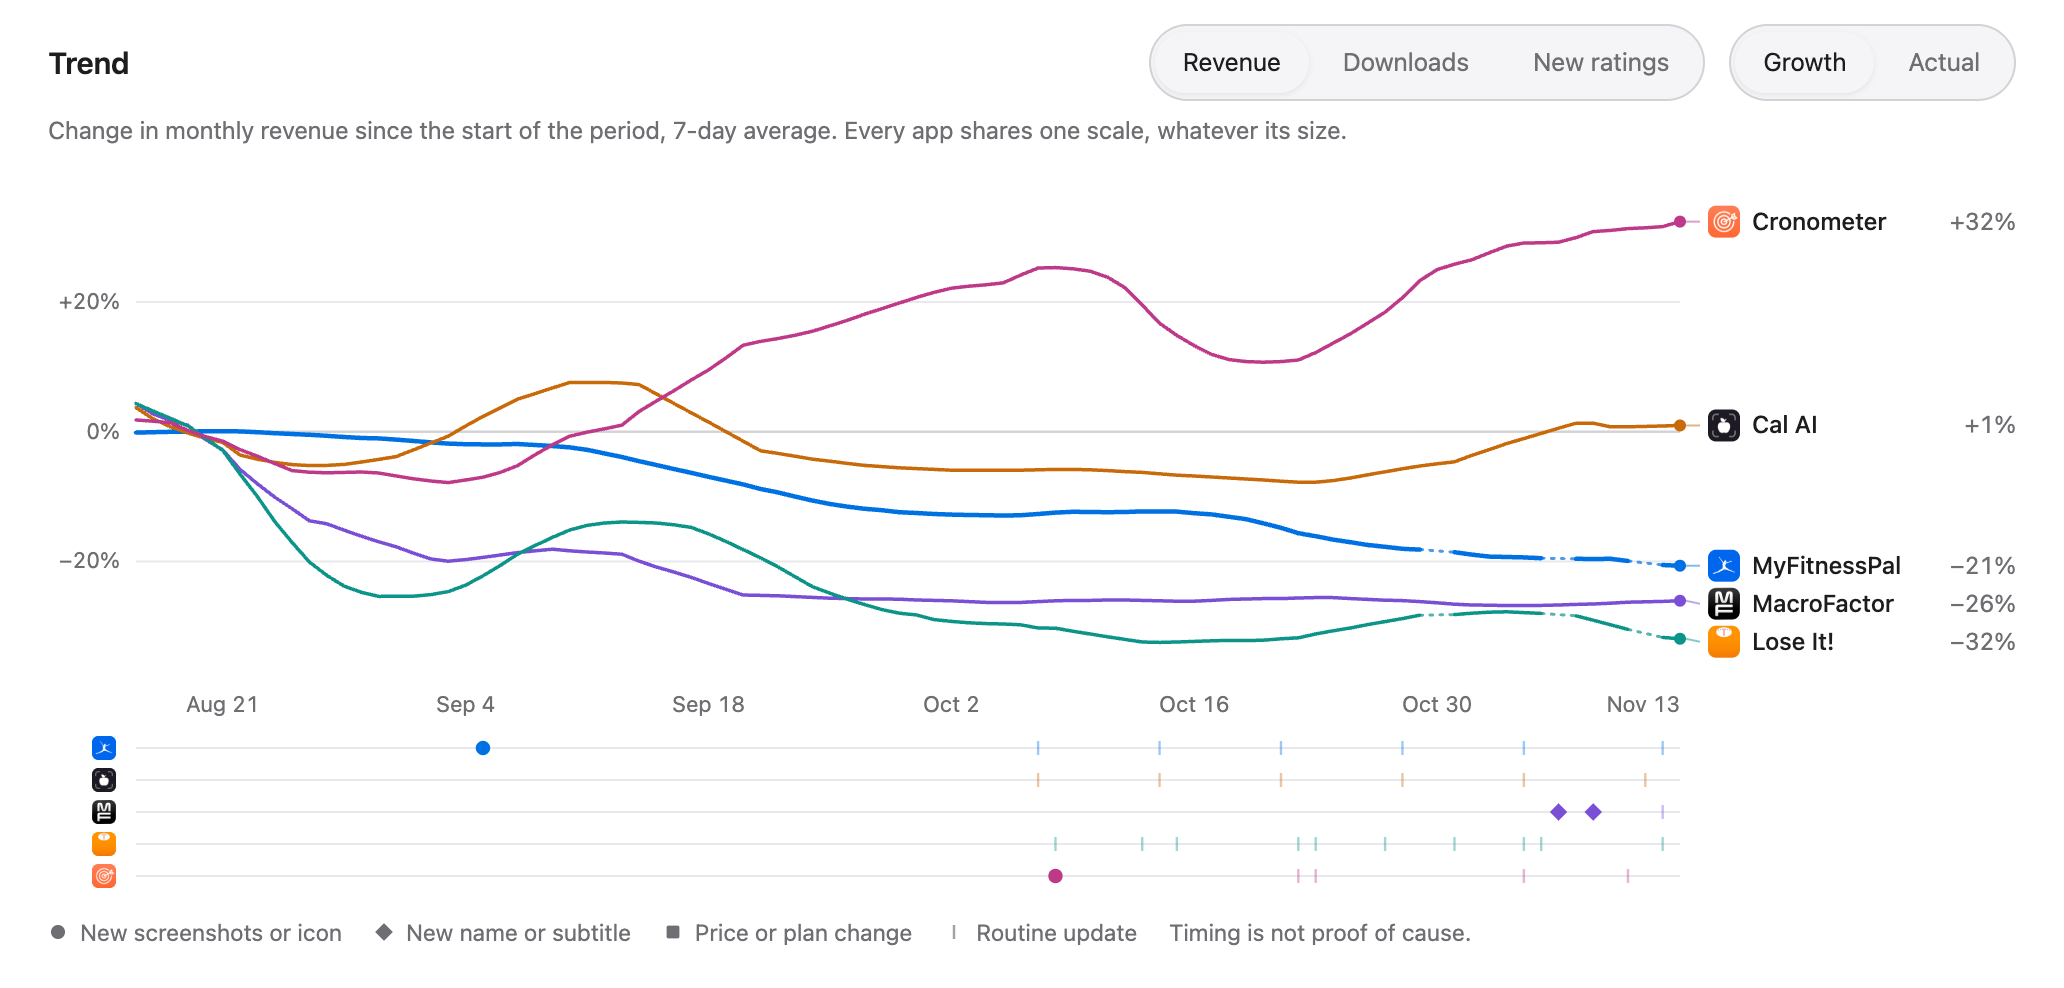
The example above is the top of the Compare screen. Under it sits the trend. Here it is for a group from the same niche over 90 days: each app's revenue as change since the start of the period, and a lane per app marking its store-page changes.
What can you compare between apps?
Who takes the money
One bar splits the group's monthly revenue between the apps, with each app's share next to its name. You see at once whether a niche has one winner or room for several.
Findings in plain words
Up to four sentences read from the same numbers as the table, such as "MyFitnessPal takes about four fifths of this group's revenue." No score to decode.
Growth on one scale
The trend shows revenue, downloads or new ratings over 30 or 90 days as change since the start of the period, on a 7-day average, so a small app and a giant can share one chart.
Store-page changes under the trend
Each app has a lane of dated marks: new screenshots or icon, a new name or subtitle, a price or plan change, routine updates. You see what changed before a line turned.
A side-by-side table
Revenue, revenue per download, downloads, new ratings, weekly, monthly and yearly plan prices, the price range, rating, number of ratings, update pace and the app's age, one column per app.
Start from one app
Open Compare from any app and it suggests competitors to add. Search adds any App Store or Google Play app by name, and one link shares the same view with a teammate.
How to run a competitor app analysis in five steps
- Start with the app you measure against. Your own app, or the leader of the niche you are thinking of entering.
- Add up to four competitors. Take the suggested ones or search by name. Keep the group to one niche: a comparison across unrelated apps says little.
- Read the split and the findings first. If one app takes most of the money, look at what it charges and how it differs. If revenue is spread evenly, the niche has room.
- Check price and pace. Compare the lowest monthly and yearly plans and how often each app ships. A leader that has stopped updating is an opening.
- Then the trend. See who is growing over 90 days and which store-page change came before each turn.
Not sure who the competitors are yet? The free app revenue checker names an app's closest competitors, and app revenue per download gives the benchmark for each category and pay model. To see who is moving in the charts this week, open trending apps; to set your own price against the category, use the app pricing calculator.
What Compare can't tell you
- Money made outside the stores. Revenue is what an app sells through the App Store or Google Play. Plans sold on an app's own website and ad income are not in it, so apps that sell mostly on the web look smaller here than they are.
- A developer's own books. Figures are GetAppNiche data, not the developer's sales report. Read them as ratios between apps and as trends: who earns several times more, who is growing, who earns more per download.
- More than five apps at once. A comparison holds up to five apps. For a whole category, use the app's Explore filters and bring the short list here.
- One revenue split across both stores. App Store and Google Play apps can sit side by side in the table, but the revenue split and the findings about revenue are drawn only when every app is on the same store.
- Plan prices that the store page does not name. Weekly, monthly and yearly prices come from App Store pages and show only where a purchase name states its length. Otherwise you see the app's price range.
- Why a line turned. The lane under the trend shows what changed on the store page and when. Timing is not proof of cause: ads, press and features leave no mark there.
- Long history on Google Play. 14–90-day growth windows and trend history are App Store only today.
Comparing apps: questions and answers
How do I compare apps by revenue and downloads?
Put the apps in one view and read ratios, not single numbers. In GetAppNiche Compare you add up to five App Store or Google Play apps and get each one's share of the group's revenue, revenue per download, downloads, plan prices, rating and update pace in one table, with the main differences written out as sentences.
What should a competitor app analysis include?
Six things answer most questions: who takes the money in the group, how much each app earns per download, what each one charges per week, month and year, how well it is rated and by how many people, how often it ships updates, and who is growing. Revenue per download and price are worth the extra minute: in the example on this page they explain a gap that ratings do not.
Can I compare an App Store app with a Google Play app?
Yes, they can sit side by side in the same table. The revenue split and the findings about revenue are drawn only when all apps are on one store, so numbers from two stores are never added together without saying so. 14–90-day growth windows and trend history are App Store only today.
How many apps can I compare at once?
Up to five: one main app and four competitors. That is enough for a niche's leader, its challengers and your own app, and it keeps every column readable on one screen.
How reliable is comparing apps by revenue?
Figures from any source other than the developer's own account differ from the developer's books. Comparisons hold up best inside one data source, one store and one category: who earns several times more, who earns more per download, who is growing. That is why Compare leads with shares and plain-word findings.
What does the example on this page show?
Five weight loss and calorie tracking apps on the US App Store (GetAppNiche data, US App Store, Nov 13, 2026). MyFitnessPal 84%, Cal AI 9%, Lose It! 3%, WeightWatchers 3%, Noom 1% of the group's monthly revenue. MyFitnessPal takes about four fifths of this group's revenue. The dollar figures for each app are in the app.
Is the app comparison tool free?
Creating an account is free and needs no card. Compare is part of GetAppNiche Pro, from $39/month, together with revenue and download figures for 3.6M+ apps across the App Store and Google Play. The free app revenue checker on this site shows one app's monthly revenue range and names its closest competitors.
Related: app market intelligence · app market research before you build · how much an app makes · top grossing iOS apps · GetAppNiche pricing